Articles · Mike Harty · Published 2026-10-24 · Updated 2026-10-24
How We Backtest EAs: Ticks, Costs, Monte Carlo, Capital
Short answer: We test EAs in the MT5 Strategy Tester on "Every tick based on real ticks" over about six years of broker data. We copy the report figures as they are, rebuild floating equity from the deal list, and size capital from a floor validated by a simulation, not from the vendor's recommended deposit. We stress the backtests with 5,000 Monte Carlo resamples and added slippage. We haven't run execution-delay tests, and we have no live or forward-test results. We say so wherever it matters.
1. Test engine and data
- Platform: MetaTrader 5 Strategy Tester on the broker's own MT5 terminal (IC Markets / Raw Trading Ltd), terminal builds 6140–6230.
- Modelling: "Every tick based on real ticks". We quote the tester's History Quality figure as reported. Our tests so far range from 100% down to 19% real ticks, where the rest of the ticks were generated. We label that test as lower confidence.
- Periods: 1 Jan 2020 to 22 Oct 2026 for most tests. One test covers 29 Feb 2020 to 13 Mar 2026.
- Account: $10,000 (one run $20,000), USD, leverage 1:500 (one run 1:5000). The deposit and leverage are shown with every result.
2. Costs
- The broker's recorded real-tick spreads, and the account's commission as charged by the tester. Example: one 0.85-lot run paid $11,028 commission and $2,809 swap over the test.
- We don't widen spreads. Slippage in the base test is whatever the EA's own input sets. We add slippage separately in the stress test (section 8). We haven't run an execution-delay test.
3. Settings
- The live inputs: the live .set file where one exists, otherwise the input list embedded in the MT5 report.
- Baselines run at 0.01 fixed lot, so results can be compared and scaled.
4. Real lot size beats scaling
Linear scaling is an approximation. For recovery and multi-order EAs it can badly understate risk. A popular MQL5 recovery EA we tested (entries split into 5 orders, a hard stop loss on every trade, and a limited martingale-style recovery that multiplies lot size ×1.6 up to 3 times after losses):
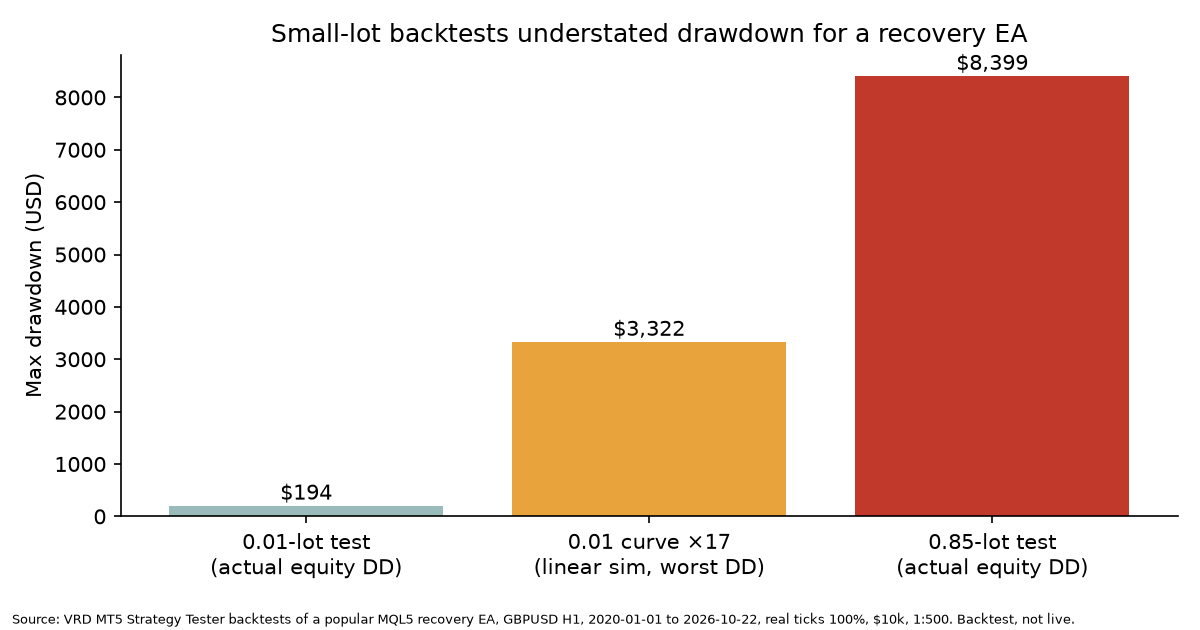
| Test | Lot | Max equity drawdown |
|---|---|---|
| Baseline | 0.01 | $194.08 |
| Baseline scaled ×17 (simulation) | ≈0.85 equivalent | $3,322 (worst episode) |
| Real-lot test | 0.85, opened as 5 orders of 0.17 | $8,399.39 |
Source: our MT5 backtests, GBPUSD H1, 1 Jan 2020 to 22 Oct 2026, 100% history quality, $10,000, 1:500. Backtests, not live results. Caveat: any capital floor derived from this depends on how the live lot actually opens. We haven't yet confirmed that the live account opens the same order structure as the backtest.
5. What we measure
- From the MT5 report, as printed: net profit, profit factor, trades, win rate, and max balance and equity drawdown ($ and %).
- Computed by us from the deal list: worst month and longest losing streak (closed P&L including commission and swap; the streak is cross-checked against MT5's "maximum consecutive losses").
- How to read these figures: reading MT5 backtest drawdown.
6. Equity reconstruction
Positions are matched first in, first out from the deal list. Every test so far has had 0 unmatched. We rebuild floating equity bar by bar on H1, M15 or M5, valuing each bar at its worst: buys at the bar low, sells at the bar high plus a spread allowance. The rebuilt closed P&L must match the report exactly before we use it. Swap is booked at close. Reports don't always end flat. One of our tests ended with a −$14.8k open basket whose outcome is unknown, so its final profit figure flatters it, and we say so.
7. Harvest simulation (how we test a capital floor)
Each EA is treated as a pod funded with a floor F: - Blow = equity at or below 5% of F. After a blow, the pod is refunded to F, and that refund counts as capital injected. - Weekly sweep: at every Friday close, realised balance above F is harvested. - Outputs: number of blows and their dates, net harvest, $/month (overall and over the last 12 months), and annual return on F, across a grid of lot sizes × floors.
8. Stress tests: Monte Carlo and slippage
Done (24 Oct 2026): - A deterministic replay of one EA's worst event, injected quarterly and six-monthly from 2024. - Monte Carlo: 5,000 resamples per EA. Each one draws the EA's backtest baskets (or clusters of overlapping trades) at random, with replacement, as many as the backtest had. The random seed is fixed so the runs can be reproduced. - Slippage: each resample set repeated at +0.5, +1 and +2 pips per basket, plus two combined cases with extra commission (+1 pip with +$3.5/lot, +2 pips with +$7/lot).
Not done yet: execution-delay tests, and any live or forward test.
Results (anonymised, from backtests)
| EA | Backtest basis | Floor | Baskets | MC max DD, P50 / P95 | Median net: 0 → +2 pips | Blow %* |
|---|---|---|---|---|---|---|
| EA A (grid) | 0.07 initial lot, $10k basis, 29 Feb 2020 to 13 Mar 2026, 19% real ticks | $6,000 | 3,148 | $4,537 / $4,537 | $16,979 → $11,885 | 0% |
| EA B (grid), all baskets | 0.2 base lot, 2020 to Oct 2026, 100% history quality | $4,000 | 5,107 | $15,245 / $29,201 | $36,410 → $6,567 | 86% |
| EA B, excluding the open end-of-test basket | as above | $4,000 | 5,106 | $7,715 / $7,715 | $51,412 → $21,513 | 63% |
| EA C (limited martingale-style recovery, hard SL on every trade), lower bound | 0.01 run ×13 per leg (0.85 = 5 orders × 0.17; live lot structure not yet verified), 2020 to Oct 2026, 100% | $4,000 | 1,004 | $1,252 / $2,337 | $10,703 → $5,839 | 0% |
| EA D (gold grid) | 0.01 run ×4 = 0.04 fixed, 2020 to Oct 2026, 99% | $4,000 | 602 | $11,474 / $11,474 | $13,686 → $11,730 | 64% |
*Blow % = share of the 5,000 runs where at least one basket's worst floating loss takes equity to 5% of the floor or below. A high blow % means the EA's worst single event is bigger than the floor, so any resample containing it breaches. It is not a forecast of how often the account will blow.
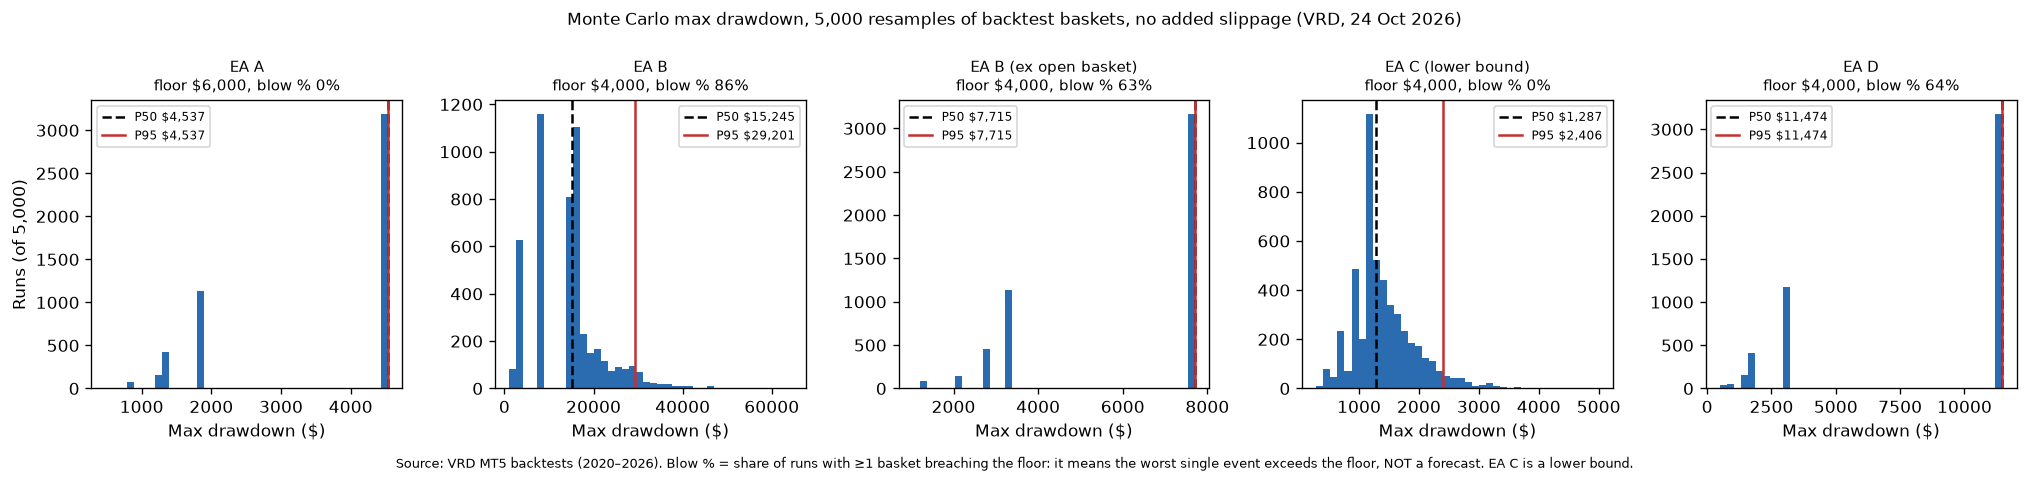
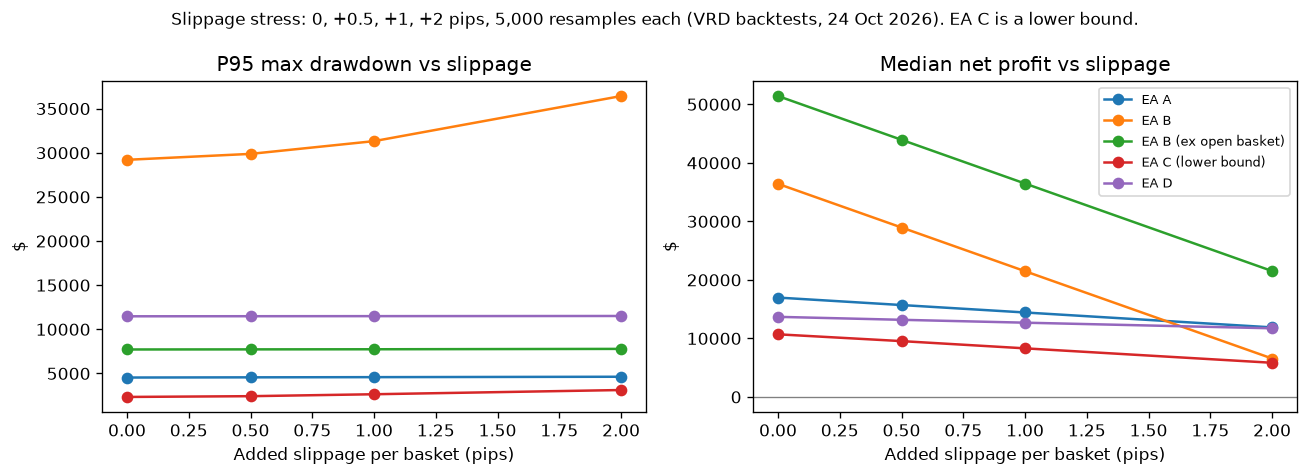
Source: VRD MT5 backtests and stress runs, 24 Oct 2026. Backtests, not live results. The histograms come from re-running the zero-slippage case with the same method; EA C's percentiles differ from the table by under 3% because of the random draw.
What this told us: - Slippage hurts profit far more than drawdown. At +2 pips, EA B's median net fell from $36,410 to $6,567, and with +$7/lot extra commission it went negative (−$3,808). EA A fell from $16,979 to $11,885. Drawdown barely moved, because one large basket dominates it. - One event sets the drawdown. For EA A, EA B (ex open basket) and EA D, P50 and P95 drawdown are identical: almost every resample includes the single worst basket. Reshuffling can't make that event smaller. - EA B's run ended on an open basket of −$14.8k. The stress counts it at its forced close (about −$15,011). Excluding it halves the P50 drawdown, but that version assumes the basket recovered, which we don't know. - EA A's backtest has only 19% real ticks (the rest generated), so its results carry lower confidence. - EA C's drawdown is a lower bound. Its basket worst floats come from realised losses (open-trade troughs weren't available), and it scales a 0.01 run. The real 0.85-lot backtest hit $8,399 of equity drawdown, far above the Monte Carlo P95 of $2,337. Its floor also depends on how the live lot opens: if 0.85 doesn't open as 5 orders of 0.17, the floor would need about $17,500.
Limits of this method
- Resampling whole baskets treats them as independent. Baskets that overlap on different symbols aren't combined, so account-level drawdown is understated.
- It can only reuse events the backtest contains. It doesn't invent a worse market.
- Slippage is charged once per basket lot (entry and exit together), which may understate it.
- Drawdown % is measured against floor plus running profit, so it can exceed 100%.
- It runs on backtests, not on live trading.
9. Capital sizing: the floor doctrine
- Floor = worst drawdown excluding extreme outliers, plus 20%.
- Top-up cap = 1.3× the historic worst drawdown. A pod is topped up only while drawdown is within that band. Anything beyond it is a stop-loss event, not a rescue.
- Class G EAs (grid/martingale/recovery without a hard per-basket stop) are sized as deliberate stop-loss floors unless the sizing survives the extreme outright. Class S EAs use a per-trade SL/TP.
- Capital is sized to the floor the harvest simulation validated, not to the vendor's recommended deposit. Our review methodology also caps the capital score where the vendor's suggested deposit wouldn't have survived the worst backtest drawdown. More in how much capital you need to run an EA.
10. What we publish, and what we don't
- We publish settings, dates, data source and report figures, with account numbers removed.
- Named-EA reviews are published only after the vendor's right of reply and live checks have cleared.
- No live or forward-test claims: we haven't exported any live deal history yet.
Guides in this series
- How to backtest an MT5 EA properly
- Reading MT5 backtest drawdown: balance, equity and relative
- Monte Carlo for MT5 backtests
- MT5 set files (coming soon)
Start free: VRD Insight
Begin with VRD Insight, the free per-EA tracker for MT5, sold through the MQL5 Market. Once an EA is live, use it to check whether the EA is behaving like its backtest. Insight's drawdown is calculated from closed trades. Then add VRD Guardian ($79) for limits, VRD Quant ($69) to turn your own backtest into a capital plan, or VRD Complete ($149) for all three plus EA Passports.
Guardian disclaimer: Guardian makes a best-effort attempt to limit losses and protect an account in difficulty using predefined rules. It cannot guarantee that losses will be avoided or that an account can be rescued. Gaps, slippage, broker or connectivity failures can prevent rules executing. Trading carries a high risk of loss.
Risk disclaimer: Backtests are historical and hypothetical, not live results, and do not predict future performance. Nothing here is investment advice. Trading leveraged products carries a high risk of loss.
Frequently asked questions
How should you backtest an MT5 EA?
Use 'Every tick based on real ticks', several years of data, the broker's real spreads and commission, and the lot size you will actually trade. Then read the equity drawdown, not just the balance drawdown.
Can I backtest at 0.01 lots and scale up?
Only for simple single-position EAs. In our tests of a popular MQL5 recovery EA, scaling the 0.01-lot result predicted about $3,300 of drawdown, while the real-lot test hit $8,399.
What is the difference between balance and equity drawdown?
Balance drawdown counts only closed trades. Equity drawdown includes the floating loss on open positions, which is what actually threatens margin.
Do you test with slippage and delays?
Partly. On 24 Oct 2026 we ran 5,000 Monte Carlo resamples of each of four EAs' backtest baskets, with added slippage of +0.5, +1 and +2 pips. We haven't run execution-delay tests, and none of this is live trading.
What does a high 'blow %' in your Monte Carlo results mean?
It means the EA's worst single backtest event is bigger than the account floor, so any resample that includes it breaches the floor. It is not a forecast of how often the account will blow.
How do you size capital for an EA?
We set a floor equal to the worst drawdown excluding extreme outliers, plus 20%. We check it in a weekly-harvest simulation that counts how often the floor would have been blown, and we ignore the vendor's recommended deposit.
One EA blowup costs more than the whole suite.
VRD Complete contains single-EA blowups and frees capital you have parked as idle buffers. $149 at launch pricing.